Enode is a visualization of the emotions that connect people together. In this Touchdesigner network, user emotions are tracked and mapped to each point in the node. As new users join the system, the nodes will connect if any emotion given overlaps with a previous one. So often, digital technology can create isolation within networks of people, but Enode shows exactly how connected we are within a communal space.
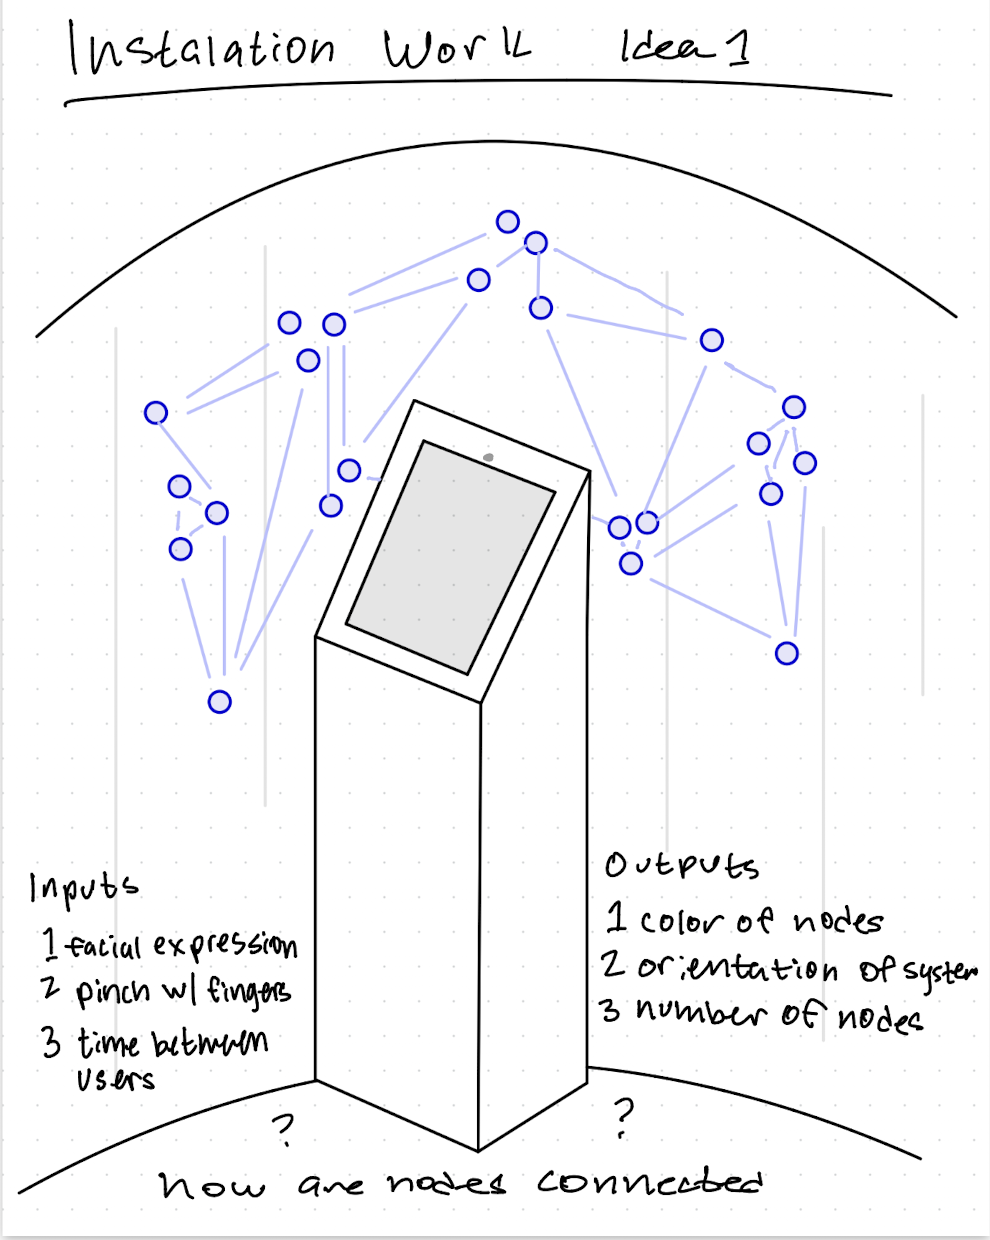
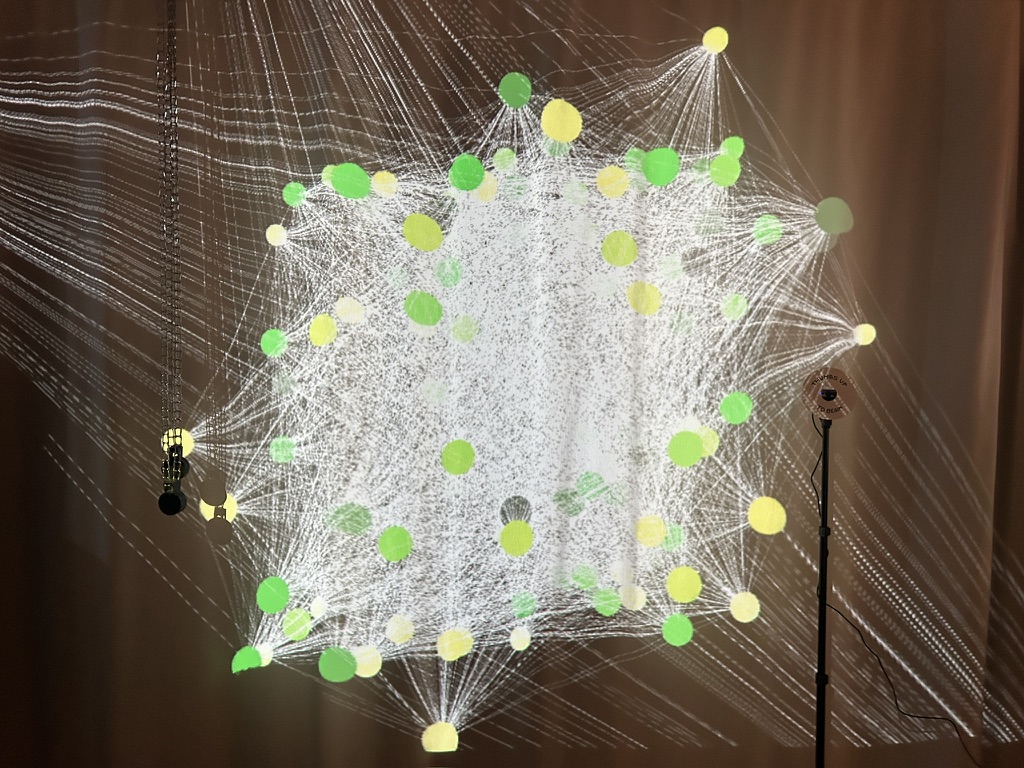
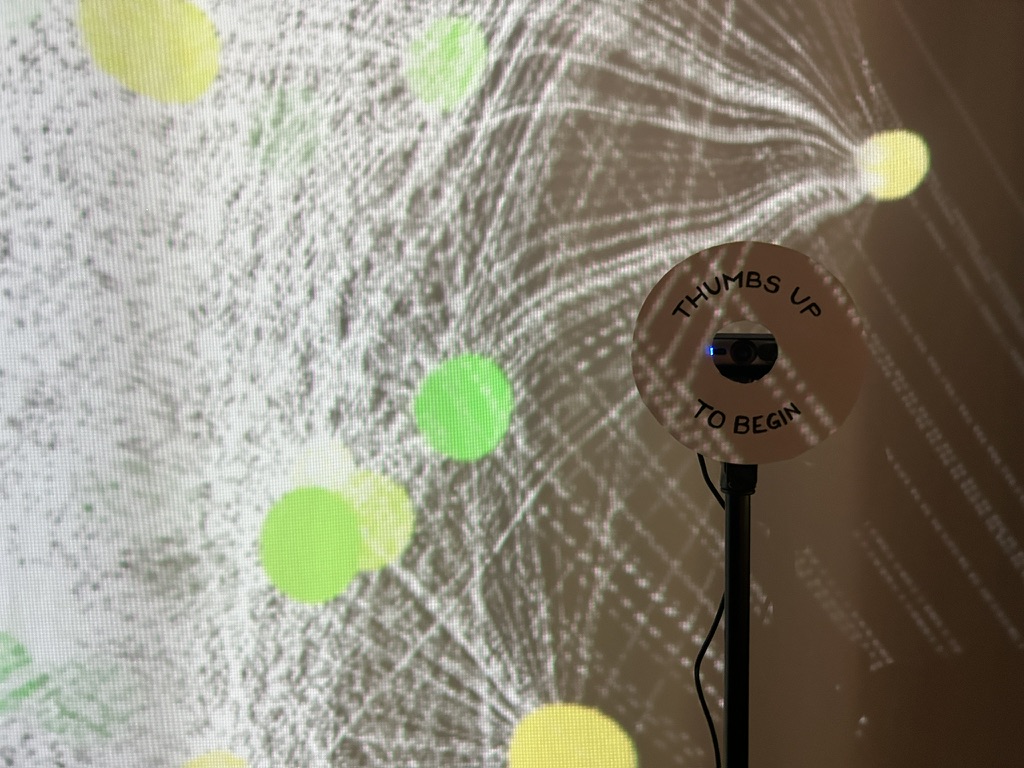
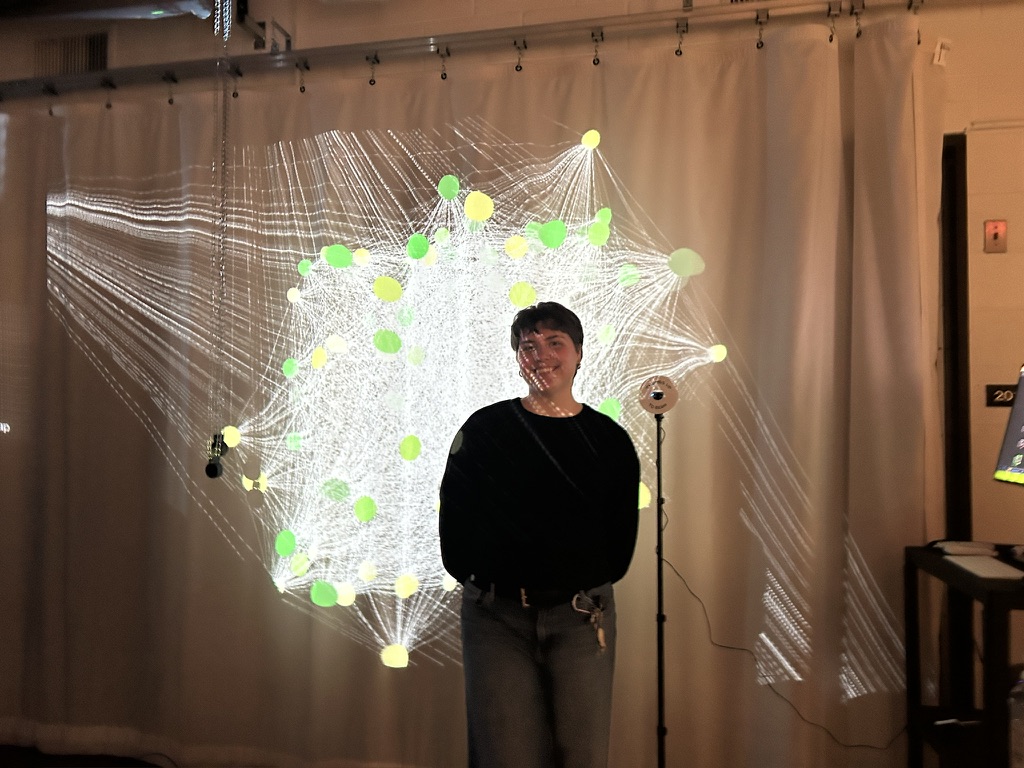
Through my years studying digital technology within the School of Information, I have found a focus on the utility of digital technology as a tool to connect people from across the globe. And yet, it cannot make up for the community that occurs when people exist in physical space together. My goal for this interactive exhibition piece was to use technology: this thing that can connect us so easily, to visualize the connections that occur outside of its presence. To visualize the emotional connections that tie people together within a shared community space. Enode would start as a single point in space--a single person, and as community grew around them, thousands of connections would begin to form.

Since this project started just around the time I would be home for a few days, I took that opportunity to begin building my input device first. This is not where I normally begin, as I normally like to make sure the concept will work before spending time building (foreshadowing!) I went through a few concepts that I believed would work for the project, but ended up creating a simple iPad holder to use as a camera and visual feedback device for the user. The design changed from a very tall device to one that could sit on a table, due to the ease of transport and the amount of scrap wood I had. This wooden holder was made entirely of scrap material and finished in a day.


Returning to campus, it was time to start developing the network. There are 6 main parts to the algorithm.


Turns out, you can't just use an iPad as a input device for Touchdesigner. And, the output of the network would not fit the screen correctly either. While there are ways to get around this, due to the time constraint and the needs of the project, I decided to pivot and find a simpler solution.

For the final for the class, we put on a pop-up exhibition to show off all of our work. Each student in the class had a space to share their work, and the space was opened to everyone. As people started to float in and test all of the projects, my network of people began to grow.
Poster design by the wonderful Ellie Lee!

By the end of the pop-up, my system had over 100 users. Each user had multiple emotions saved, and there were over 3,000 connection lines connecting each node. These nodes are representative of each person who walked up to the exhibit.


In this demo, I show how the network grows with a single person. In the actual exhibit, nodes would be added when new users enter the frame and give a thumbs up to the camera.